
AI Code Writer for Debugging: Paste an Error, Get the Root Cause and a Fix
An AI code writer for debugging is an assistant you paste a broken snippet and its error into — you feed it into an ai code writer, it finds the root cause, and hands back a corrected version with an explanation. You skip the manual trace-walking and get a diagnosis in seconds instead of minutes.
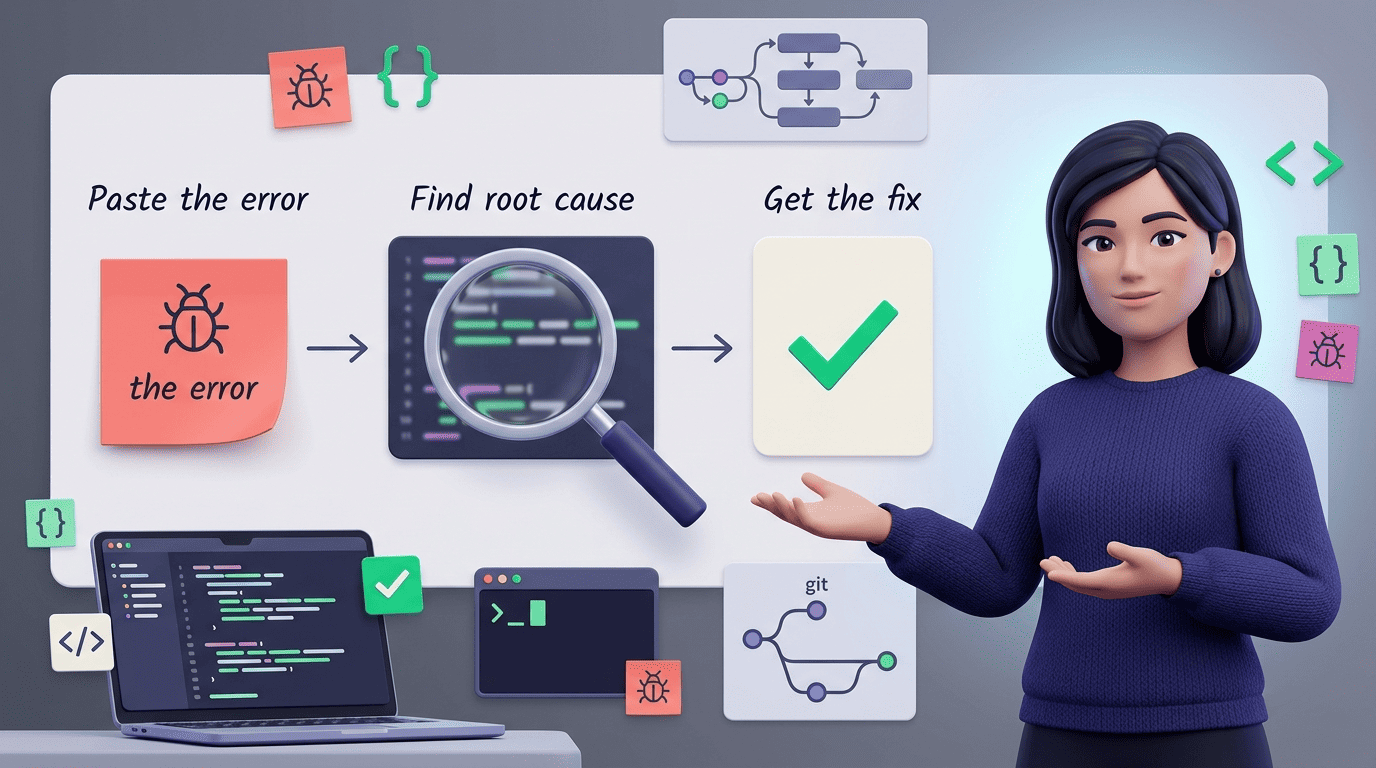
Unlike a plain autocomplete tool, a debug-focused AI code writer treats a stack trace and a failing test as evidence: it localizes the exact line, names the class of bug, and proposes the smallest change that fixes it — not a rewrite of the whole file.
How an AI Code Writer Debugs: From Error Text to Fix
A debugging pass is not one action but a short pipeline: the assistant parses what you gave it, cross-references the code against the error, and only then writes a fix. The quality of the output depends almost entirely on how much of that pipeline you feed it.
The paste-diagnose-fix loop
You give the assistant three things — the code, the exact error text or traceback, and what you expected to happen instead. The AI code writer lines these up, names the root cause rather than just the symptom, and returns the corrected fragment with a short «why.» Tools like SuperNinja pitch this workflow directly — paste the error, get the fix — and most of these assistants run the request through an underlying model such as GPT, Gemini, or Claude before returning the diagnosis.
What you paste matters more than which tool you use:
- The full code block that raised the error, not just the offending line
- The complete error message or traceback, copied verbatim
- What you expected the code to do instead
Why root cause beats symptom
A symptom is «TypeError on line 42.» A root cause is «the variable arrives as None because the function above it silently returns an empty result when the lookup misses.» A fix that only wraps the crash in a try/except hides the bug instead of removing it — it will resurface somewhere else in the call chain.
Everyone knows that debugging is twice as hard as writing a program in the first place. So if you’re as clever as you can be when you write it, how will you ever debug it?
Brian Kernighan
That gap between symptom and cause is exactly what an AI code writer is built to close: it has no attachment to the code it didn’t write, so it traces the value backward without the blind spots a tired author develops after staring at the same function for an hour. It also doesn’t get tired of asking «but why did that happen» one more level down, which is usually where the real cause is hiding.
The table below maps a few common symptom messages to the root cause an AI code writer typically surfaces once it traces the value backward through the call chain.
| Symptom you see | Likely root cause |
|---|---|
TypeError: 'NoneType' object is not subscriptable | An earlier function returned None instead of a list or dict |
IndexError: list index out of range | Loop bound is off by one, or the list was shorter than assumed |
Cannot read properties of undefined (reading 'x') | An async call resolved after the property was already accessed |
| Test passes locally, fails in CI | Hidden dependency on execution order or an unset environment variable |
Reading a Stack Trace / Traceback
Before an AI code writer can diagnose anything, it has to parse the traceback the same way an experienced developer does — and that means starting at the bottom, not the top.
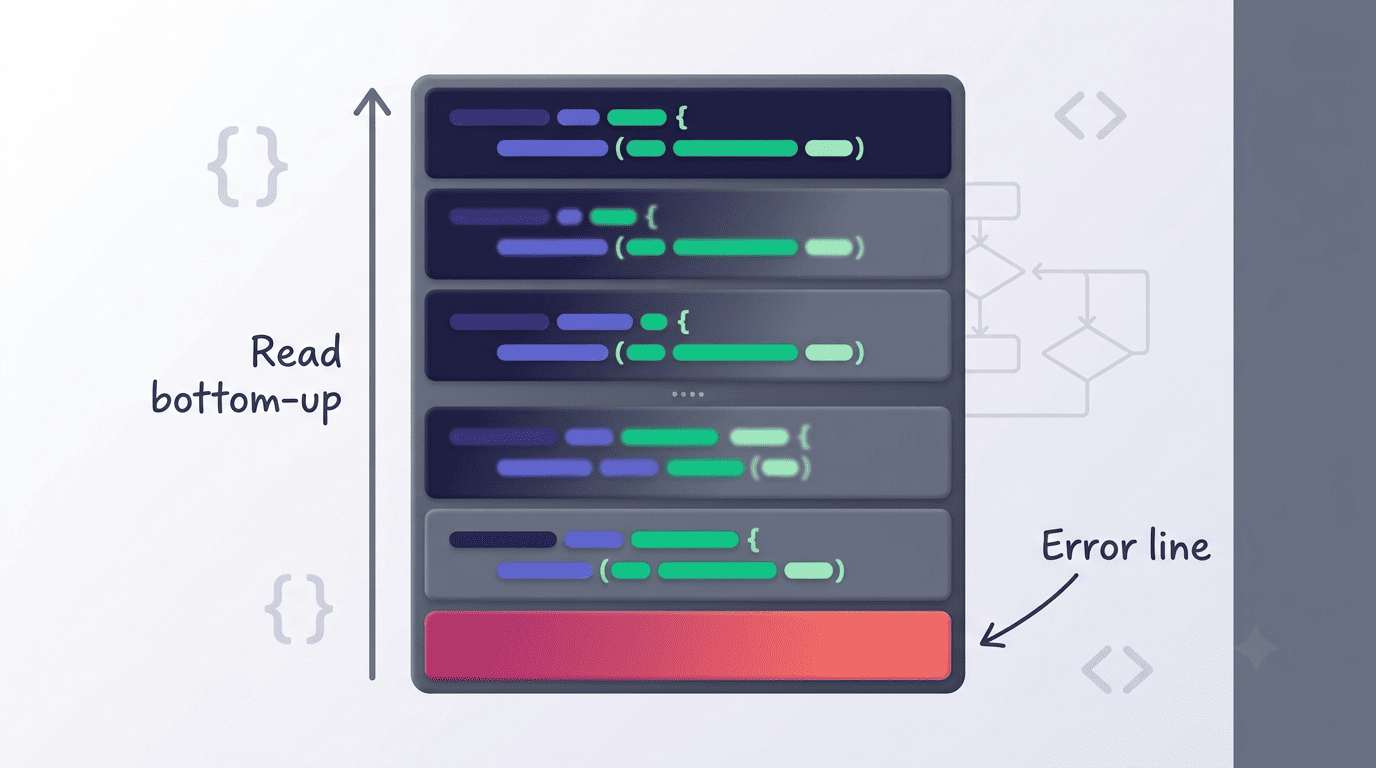
Read a traceback bottom-up
In Python, the convention is to read the traceback from the bottom up: the last line carries the exception type and message, and each line above it is one more frame in the call chain leading to the crash. The official Python documentation for the traceback module shows exactly this layout — exception message last, call chain above it. An AI code writer automates that walk — it names the file, the line, and the function where the failure actually originated, not just where the exception was raised.
Browser and JS errors
JavaScript surfaces the same idea differently: the browser console prints a stack under messages like Uncaught TypeError: Cannot read properties of undefined (reading 'name'). MDN’s reference on the Error object documents how these error objects carry a message, a name (the error type), and a stack property. Paste that console output alongside the code, and an AI code writer for debugging connects «undefined» to the specific line where the value was never initialized.
Common Bug Classes an AI Code Writer Catches
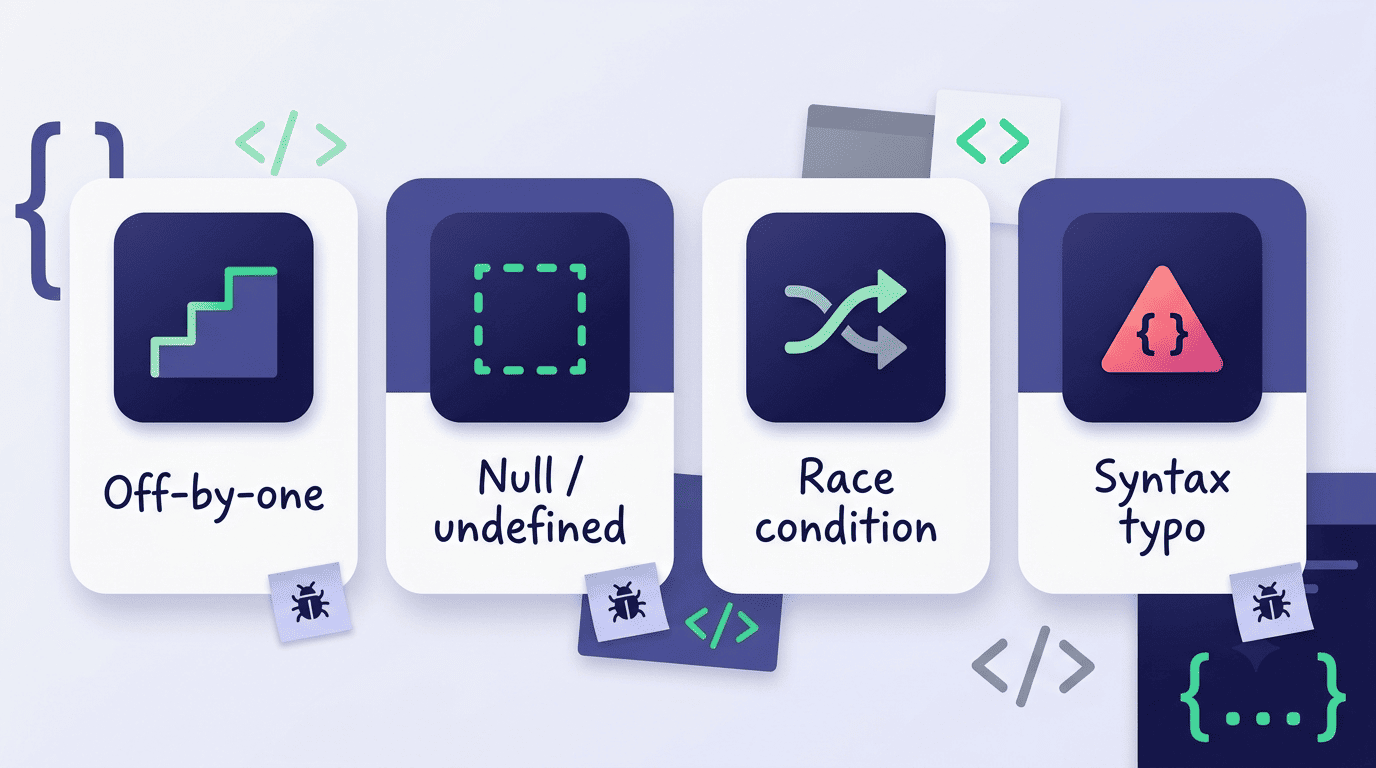
Most bugs an AI code writer flags fall into a handful of repeating categories, and recognizing the category is often half the fix.
Off-by-one and boundary errors. An off-by-one error is a classic logic error at the edge of a loop or index — using <= where < was needed, or confusing len(list) with len(list) - 1. Wikipedia’s entry on the off-by-one error documents the pattern and its typical causes. An AI code writer catches these by mentally running the boundary values through the loop and flagging where the range slips by one.
Null and undefined references. Reaching into a property on None or undefined is the single most common runtime crash across both Python and JavaScript. An AI code writer traces backward through the call chain to find where the empty value first appeared, then suggests a guard clause or an early return instead of a blanket exception handler.
Async races and concurrency. A race condition is a bug where the outcome depends on the timing or interleaving of concurrent operations — a missing await, or two tasks mutating the same shared state. Wikipedia’s article on race conditions explains why these bugs are timing-dependent by definition. They rarely reproduce «on demand,» so an AI code writer works from the code’s structure rather than from a single failed run to point at the missing synchronization.
These four bug classes account for most of what an AI code writer flags in a typical review pass, and each one has a different tell:
| Bug class | Typical tell | What the AI code writer suggests |
|---|---|---|
| Off-by-one | Loop runs one time too many or too few | Swap the boundary operator or index offset |
| Null / undefined reference | Crash on a property access, not on assignment | Guard clause or early return where the value can be empty |
| Race condition | Intermittent failure, disappears under a debugger | Add the missing await or lock around shared state |
| Syntax / typo | Fails before the program even runs | Point at the exact character or missing bracket |
Signs a bug you’re chasing is actually a race condition rather than a simple logic error:
- The failure only happens sometimes, not on every run
- Adding a
console.logorprintstatement makes the bug disappear - The bug appears under load or with multiple requests but not in isolation
- Two pieces of code touch the same variable, cache, or file without locking
Rubber-Duck Debugging with an AI Code Writer
Rubber duck debugging is the practice of explaining your code out loud, line by line, to force yourself to notice what it actually does rather than what you assume it does. Wikipedia describes the technique and its roots in the idea that articulation exposes gaps in reasoning that silent reading skips over.

An AI code writer makes a patient, endlessly available duck. You ask it to «explain what this loop does» or «walk through this function step by step,» and the mismatch between what you meant and what the code actually does often surfaces inside the explanation itself, before any error message appears. If you want to see the loop in action on your own snippet, you can try ai code writer on the next stack trace you hit instead of scrolling through old forum threads.
Fixing Failing Tests
A failing test is one of the cleanest inputs you can hand an AI code writer, because the expected behavior is already written down as an assertion.
From red to green
Paste the failing test and its assertion message, and the assistant judges whether the code is wrong or the test’s expectation is wrong — both happen in practice. Some tools, such as Zentara, intercept pytest assertion failures directly, apply a fix, and rerun the suite automatically until it passes; Zentara itself advertises a mean-time-to-repair reduction of up to 60%. For anything you plan to ship, run the ai code writer for debugging fix against your own test suite before you trust it — a passing assertion in isolation doesn’t guarantee the rest of the suite still passes.
Debugging checklist
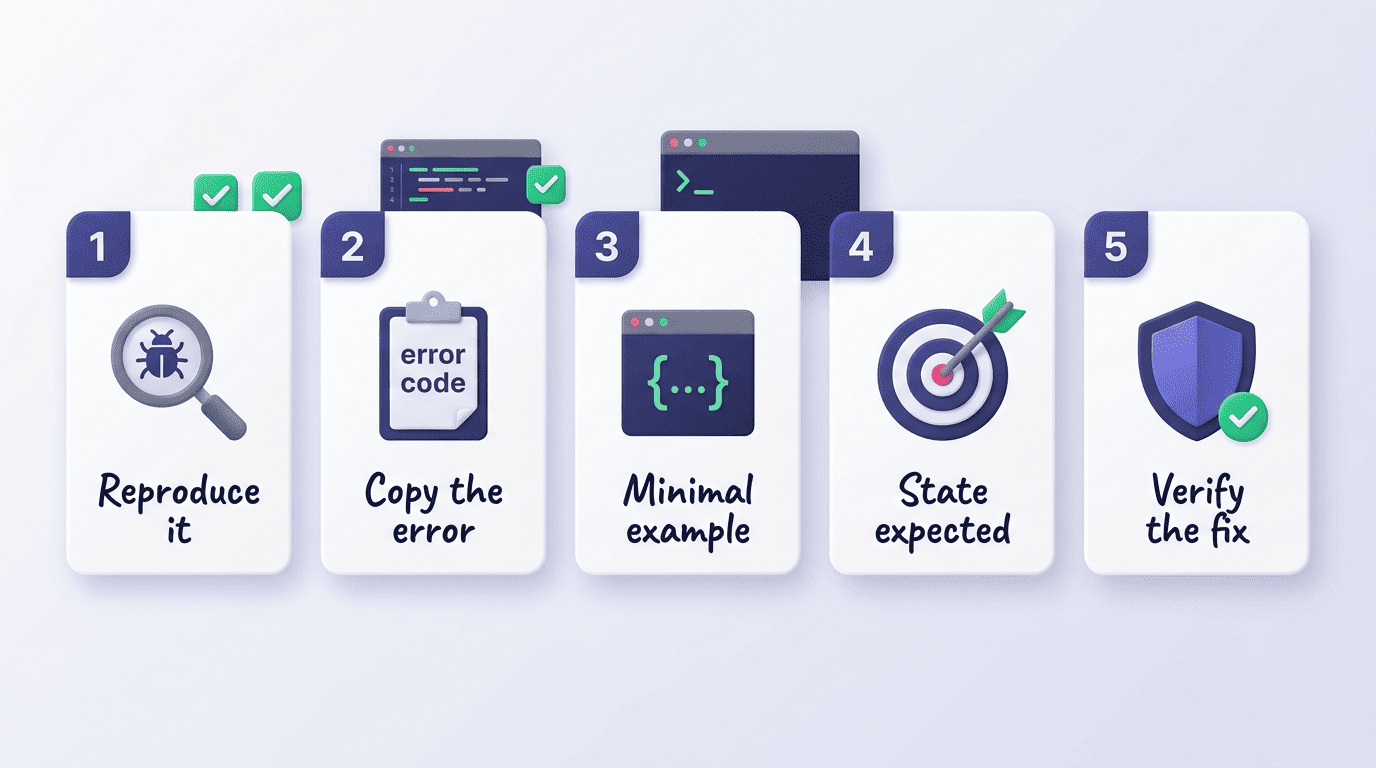
A short, repeatable checklist gets better answers out of any AI code writer, in this order:
- Reproduce the bug locally so you have a reliable failure to work from
- Copy the exact error text or traceback, not a paraphrase of it
- Reduce the code to the smallest snippet that still reproduces the failure
- State what you expected the code to do instead of the crash
- Run the suggested fix against your own tests and data before merging it
Limits: Always Verify the Fix
An AI code writer speeds up diagnosis, but it does not replace verification — the two are different jobs.
It can propose a method that doesn’t exist on the object you’re calling it on, or a fix that resolves one failing test while quietly breaking a different case it never saw. Free tools also tend to cap how much you can paste in a single request — zzzcode’s debugger, for instance, limits input to 10,000 characters — which forces you to trim large files down to the relevant function before pasting.
Where an AI code writer still needs a human to check its work:
- Fixes that touch shared state, caches, or anything else with side effects
- Any suggestion involving a library method you haven’t personally verified exists
- Security-sensitive code paths, such as authentication or input validation
- Large, unfamiliar codebases where the assistant only sees the pasted fragment, not the whole system